01 Measurement
1.1 Physical Quantities
6 Topics | 3 Quizzes
02 Force and Motion 1
2.1 Linear Motion
7 Topics | 3 Quizzes
2.2 Linear Motion Graphs
4 Topics | 2 Quizzes
2.3 Free Fall Motion
1 Topic | 1 Quiz
2.4 Inertia
2 Topics | 1 Quiz
2.5 Momentum
4 Topics | 3 Quizzes
2.6 Effects of Force
2 Topics | 2 Quizzes
2.7 Impulse and Impulsive Force
3 Topics | 2 Quizzes
03 Gravitation
3.1 Newton’s Law of Universal Gravity
3 Topics | 3 Quizzes
3.2 Kepler’s Law
1 Topic | 1 Quiz
3.3 Human Made Satelite
2 Topics | 1 Quiz
04 Heat
4.1 Thermal Equilibrium
4 Topics
4.2 Specific Heat Capacity
6 Topics | 2 Quizzes
4.3 Specific Latent Heat
6 Topics | 2 Quizzes
4.4 Gas Laws
5 Topics | 2 Quizzes
05 Waves
5.1 Fundamentals of Waves
5 Topics | 4 Quizzes
5.2 Damping and Resonance
3 Topics | 2 Quizzes
5.3 Reflection of Waves
2 Topics | 1 Quiz
5.4 Refraction of Waves
6 Topics | 2 Quizzes
5.5 Diffraction of Waves
2 Topics | 2 Quizzes
5.6 Interference of Waves
3 Topics | 2 Quizzes
5.7 Electromagnetic Waves
2 Topics | 2 Quizzes
06 Light and Optics
6.1 Refraction of Light
3 Topics | 2 Quizzes
6.2 Total Internal Reflection
1 Topic | 1 Quiz
5.1.4 Displacement-Distance Graph
Displacement – Distance Graph
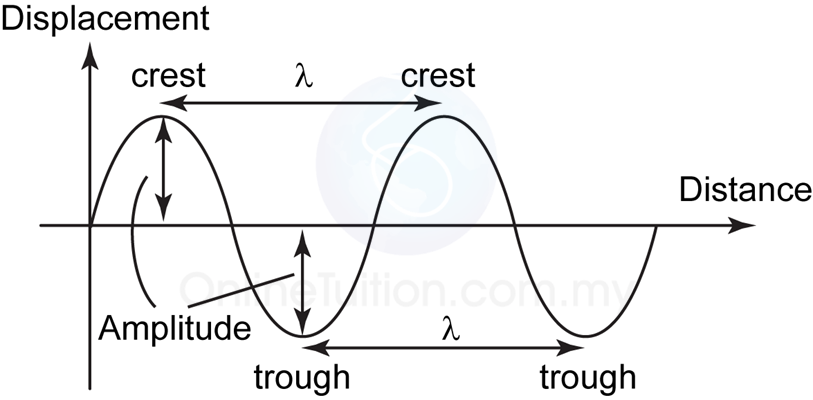
- A Displacement – Distance graph shows the position of each particle in a wave relative to its distance from a reference point.
- The distance between two (2) successive crest or trough is the wavelength.
- The maximum displacement of the particles from the equilibrium position (displacement = 0) is the amplitude.
- The amplitude of the wave will increase as the energy transfers by the wave increase and vice versa.
Comparing Displacement-Time Graph and Displacement- Distance Graph
 |
| (Displacement-time graph – Graph of oscillation) |
 |
| (Displacement-distance graph – Graph of Waves) |
- Both the displacement-time graph and the displacement distance graph looked similar. However, they are 2 different types of graph.
- The displacement-time graph illustrates the displacement of an object over time whereas the displacement-distance graph tells the position of the vibrating particles of a wave.
- For a displacement- time graph, the distance between 2 crest/trough represent the period whereas for the displacement-distance graph, it represents the wavelength.