Apparent Weight of an Object in a Lift

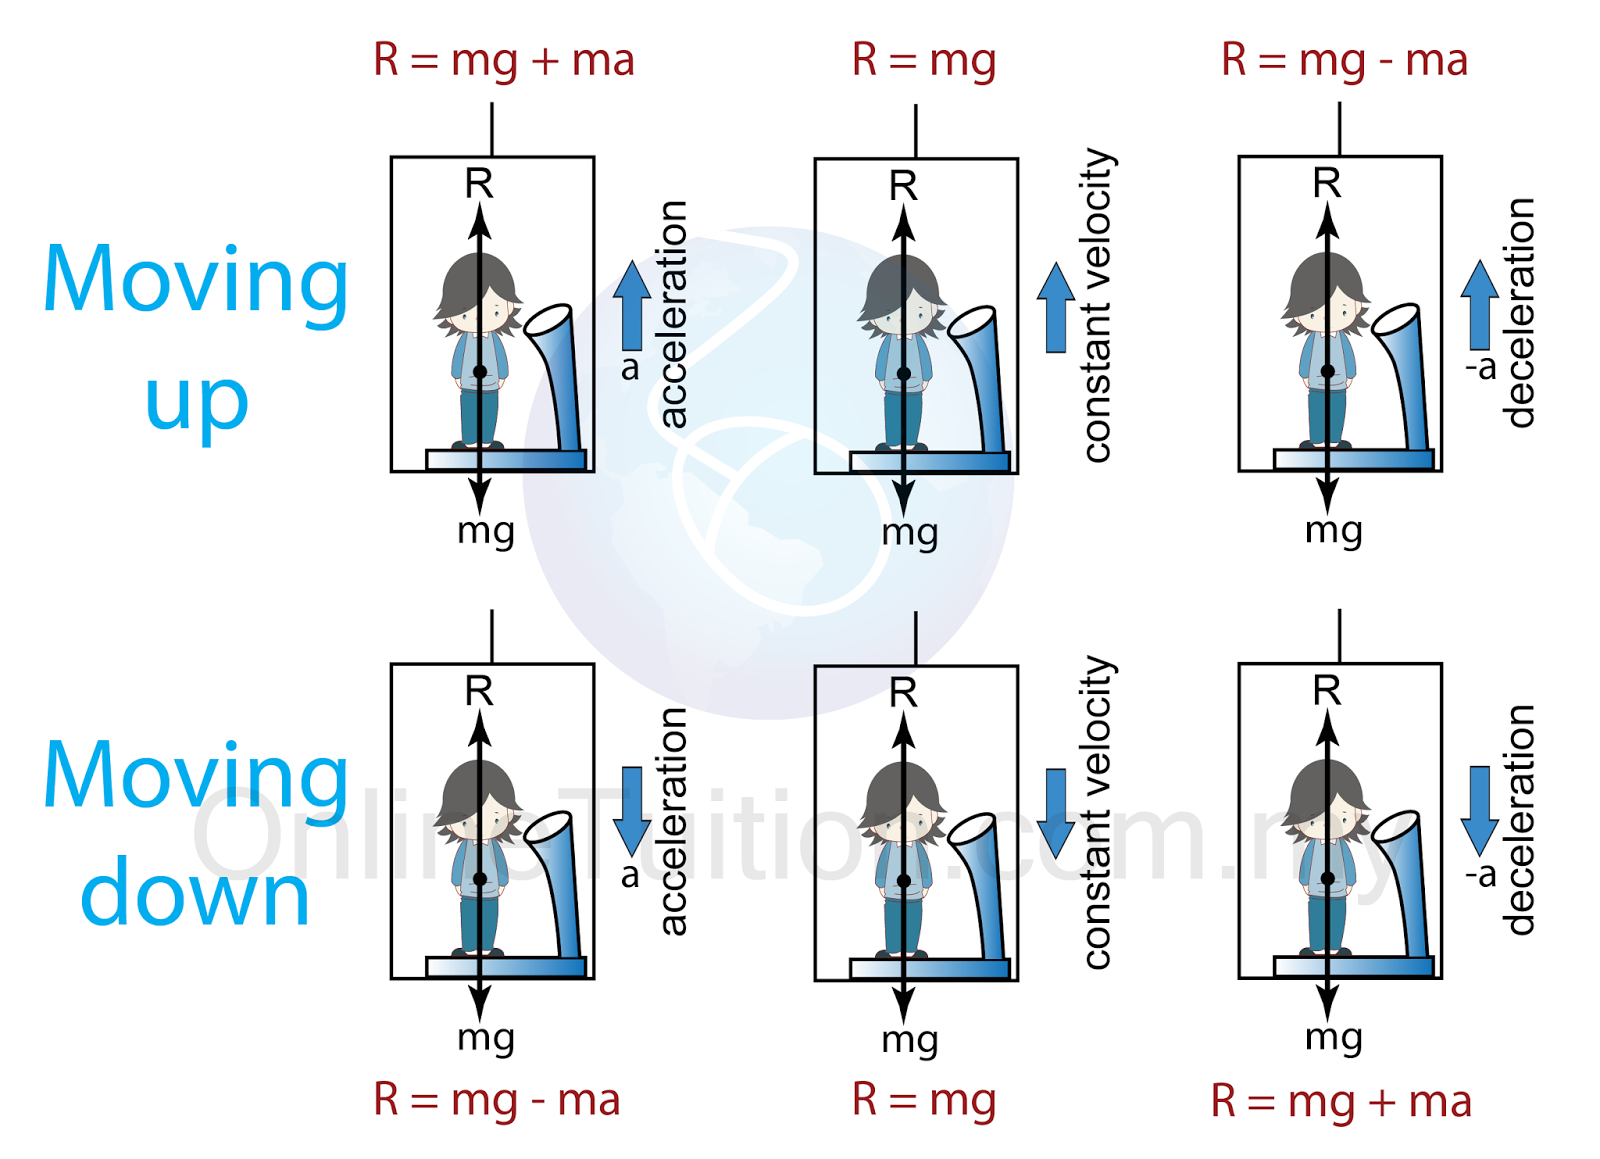
  1. When a man standing inside an elevator, there are two forces acting on him.
    1. His weight, (W) which acting downward.
    2. Normal reaction (R), acting in the opposite direction of weight.
  2. The reading of the balance is equal to the normal reaction (R).
  3. Figure below shows the formula to calculate the reading of the balance at different situation.

Example 1:
Subra is standing on a balance inside an elevator. If Subra’s mass is 63kg, find the reading of the balance when the lift,

  1. stationary
  2. moving upward with a constant velocity, 15 ms-1.,
  3. moving upward with a constant acceleration, 1 ms-2.
  4. moving downward with a constant acceleration, 2 ms-2.

Answer:
a.

W = mg
W = (63)(10) = 630N

b.

W = mg
W = (63)(10) = 630N

c.

R = mg+ma
R = (63)(10)+(63)(1)
R = 693N

d.

R = mg−ma
R = (63)(10)−(63)(2)
R = 504N


Example 2:
A 54kg boy is standing in an elevator. Find the force on the boy’s feet when the elevator

  1. stands still
  2. moves downward at a constant velocity of 3 m/s
  3. decelerates downward with at 4.0 m/s2,
  4. decelerates upward withat 2.0 m/s2.

Answer:
a.

W = mg
W = (54)(10) = 540N

b.

W = mg
W = (54)(10) = 540N

c.

R=mg+ma
R=(54)(10)+(54)(4)
R=756N

d.

R=mg−ma
R=(54)(10)−(54)(2)
R=432N


Linear Motion

  1. Kinematics is the research regarding the types of movement of an object without referring to the forces that cause the movement of the object.
  2. Movement along a straight line is called linear motion.
  3. Under the linear motion, we study the
    1. distance and displacement
    2. speed and velocity
    3. acceleration
      and the relationship between them.

SPM Form 4 Physics Chapter 2 – Force and Motion

Chapter 2: Force and motion

  1. Linear Motion
    1. Distance and Displacement
    2. Speed and Velocity
    3. Acceleration
  2. Motion with Uniform Acceleration
  3. Ticker Timer and Ticker Tape
    1. Finding Velocity from Ticker Tape
    2. Finding Acceleration from Ticker Tape
  4. Graph of Motion
    1. Displacement-Time Graph
    2. Velocity-Time Graph
    3. Graph of Free Falling Object
  5. Mass and Inertia
    1. Applications of Effect of Inertia
  6. Momentum
    1. Principle of Conservation of momentum
    2. Elastic and Inelastic Collision
    3. Application of Momentum
  7. Effects of Force
  8. Types of Forces and Newton’s Third Law of Motion
  9. Impulse
  10. Impulsive Force
  11. Safety Features in Vehicles
  12. Gravity
    1. Free Falling
    2. Lift
    3. Pulley
  13. Vector Quantities
    1. Vector Addition
    2. Vector Resolution
    3. Inclined Plane
    4. Forces in Equilibrium
  14. Work
    1. Work Done by/Against the Gravity
    2. Finding Work Done from a Graph
  15. Energy
    1. Potential Energy
    2. Kinetic Energy
    3. Relationship between Energy and Work Done
  16. Power
    1. Efficiency
  17. Elasticity
    1. Hooke’s Law
    2. Spring
  18. Formulae List – Mind Map

Videos

  1. Introduction
  2. Distance vs Displacement – Part 1 | Part 2 | Example
  3. Speed and Velocity | Example
  4. Acceleration Part 1 | Part 2 | Example
  5. Positive and Negative Sign of Acceleration
  6. Analysing Acceleration
  7. Uniform Acceleration – Learning Focus
  8. Equation of Uniform Acceleration 
  9. Motion with Uniform Acceleration | Example 1 | Example 2 | Example 3 | Example 4 | Example 5
  10. Uniform Acceleration – Technique in Answering Calculation Questions
  11. Ticker Tape – Introduction
  12. Ticker Tape Timer
  13. Ticker Tape (Sample Question)
  14. Ticker Tape – Dots and Ticks
  15. Analysing Ticker Tape
  16. Ticker Tape Chart | Example 1
  17. Finding Time from a Ticker Tape
  18. Finding Velocity from a Ticker Tape – Part 1 | Part 2
  19. Finding Acceleration from a Ticker Tape
  20. Finding Acceleration from a Ticker Tape Chart
  21. Steps in Solving Linear Motion Problems – Part 1 (Common Mistake)
  22. Step in Solving Linear Motion Problems – Part 2 (Choose the Correct Equation)
  23. Step in Solving Linear Motion Problems – Part 3 (Substitution and solving the Equation)
  24. Steps in Solving Linear Motion Problems – Example 1 | Example 4
  25. Graph of Motion – Learning Focus
  26. Gradient of a Graph – Part 1 | Part 2
  27. Area Below the Graph
  28. Displacement-Time Graph | Continue
  29. Velocity-Time Graph | Continue
  30. Displacement – Time Graph (Exercise 1) | Exercise 2
  31. Velocity-Time Graph | Continue | Example
  32. Displacement-Time Graph to Velocity-Time Graph
  33. Acceleration-Time Graph – Part 1 | Part 2
  34. Graph of Free Falling – Part 1 | Part 2 | Part 3 | Part 4 |Part 5 | Part 6
  35. Mass and Inertia
  36. Momentum – Introduction
  37. Understanding Momentum – Part 1 | Part 2 | Part 3 |Part 4 | Part 5
  38. Principle of Conservation of Momentum – IntroductionThe Equation | Summary of the Equations
  39. Applications Principle of Conservation of Momentum – Part 1 | Part 2
  40. Work Done
  41. Kinetic Energy
  42. Potential Energy
  43. Principle of Conservation of Energy
  44. Elasticity of Substances and Hooke’s Law
  45. Factors That Affect the Elasticity of Springs

Ammeter and Voltmeter

  1. Ammeters are measuring instrument used to measure electric current.
  2. Voltmeters are measuring instrument used to measure potential difference (voltage).
  3. In SPM syllabus, you need to know
    1. how to take reading from ammeter and voltmeter
    2. how to identify the sensitivity of an ammeter and voltmeter.
    3. the connection of ammeter and voltmeter in a circuit.
  4. An ammeter is always connected in series with the load (resistor) in a circuit.
  5. A voltmeter is always connected parallel to the load (resistor) in a circuit.

External Link

Micrometer Screw Gauge

Label of the Parts

(This image is licienced under GDFL. The source file can be obtained from wikipedia.org)

Range and Accuracy

  1. The range of a micrometer is 0-25mm.
  2. The accuracy of a micrometer is up to 0.01mm.

How to Use a Micrometer?

  1. Turn the thimble until the object is gripped gently between the anvil and spindle. 
  2. Turn the ratchet knob until a “click” sound is heard. This is to prevent exerting too much pressure on the object measured. 
  3. Take the reading.

    How to Read the Reading?

    Reading = Reading of main scale + Reading of thimble scale.

    Reading of main scale = 0 – 25 mm
    Reading of thimble scale = 0 – 0.49mm

    Example

    (This image is licensed under GDFL. The source file can be obtained from wikipedia.org.)

    Reading of main scale = 5.5mm
    Reading of thimble scale = 0.28mm

    Actual Reading = 5.5mm + 0.28mm = 5.78mm
    Youtube Video

    Precaution Steps

    1. The spindle and anvil are cleaned with a tissue or cloth so that any dirt present will not be measured. 
    2. The thimble must be tightened until the first click is heard. 
    3. The zero error is recorded.

      Interactive Animation
      SHAW : micrometer (Java Applet)

      External Link
      The Micrometer – Upscale.Utoronto.ca

      < PreviousKBSM | KSSMNext >

      Vernier Caliper

      1. Vernier calliper is a measuring tool used to measure length.
      2. It is more accurate than the metre rule. It can measure the length with an accuracy up to 0.01cm.
      3. The figure above shows the illustration of a vernier calliper. For SPM students, you need to remember the name of the parts and the function of the 2 jaws and the stem.

      Taking Reading from a Vernier Calipers:

      1. A vernier calliper has 2 scales, namely the main scale and the vernier scale.
      2. The main scale is read at the zero mark of the Vernier scale.
      3. The vernier scale is read at the point where it’s scale coincide with the main scale.
      4. Reading of Vernier calliper = Reading of main scale + reading of vernier scale.
      5. The vernier scale is 9mm long, divided into 10 divisions.

      Example:

      Reading of main scale = 2.2cm
      Reading of vernier scale = 0.07cm
      Reading of the vernier calliper = 2.27cm

      Zero Error of Vernier Caliper

      1. The zero error is determined by tightening the jaws of the vernier callipers.
      2. Zero error must be eliminated from the reading.
      Actual Reading = Reading of Vernier Caliper – Zero Error

      Example:
      Images below show the reading of 3 vernier callipers when their jaws are tightly closed. Find the zero error of each calliper.
      a.

      Zero error = 0.02 cm

      b.

      Zero error = -0.06cm

      c.

      Zero error = 0 cm (No zero error)

      External Link

      Ruler, Thermometer and Stopwatch

      Ruler

      A metre rule has sensitivity or accuracy accuracy of 1mm.
      Precaution to be taken when using ruler

      1. Make sure that the object is in contact with the ruler.
      2. Avoid parallax error.
      3. Avoid zero error and end error.

      Thermometer

      There are 2 types of mercury thermometer

      1. Thermometers of range -10oC – 110oC with accuracy 1oC.
      2. Thermometers of range 0oC – 360oC with accuracy 2oC.


      Precaution to be taken when using a thermometer

      1. Make sure that the temperature measured does not exceed the measuring range.
      2. When measuring the temperature of a liquid
        1. immerse the bulb fully in the liquid
        2. stir the liquid so that the temperature in the liquid is uniform
        3. do not stir the liquid vigorously to avoid breaking the thermometer

      Stopwatch


      There are 2 types of stopwatches

      1. analogue stopwatches of sensitivity 0.1s or 0.2s
      2. digital stopwatches of sensitivity 0.01s.

      The sensitivity of a stopwatch depends on the reaction time of the user.

      Consistency, Accuracy and Sensitivity

      Precision

      1. Precision is the ability of an instrument in measuring a quantity in a consistent manner with only a small relative deviation between readings.
      2. The precision of a reading can be indicated by its relative deviation.
      3. The relative deviation is the percentage of mean deviation for a set of measurements and it is defined by the following formula:

      Accuracy

        1. The accuracy of a measurement is the approximation of the measurement to the actual value for a certain quantity of Physics.
        2. The measurement is more accurate if its number of significant figures increases.
        3. Table above shows that the micrometer screw gauge is more accurate than the other measuring instruments.

        1. The accuracy of a measurement can be increased by 
          1. taking a number of repeat readings to calculate the mean value of the reading. 
          2. avoiding the end errors or zero errors. 
          3. taking into account the zero and parallax errors. 
          4. using more sensitive equipment such as a vernier calliper to replace a ruler. 
        2. The difference between precision and accuracy can be shown by the spread of shooting of a target (as shown in the Diagram below).

        Sensitivity

        1. The sensitivity of an instrument is its ability to detect small changes in the quantity that is being measured.
        2. Thus, a sensitive instrument can quickly detect a small change in measurement.
        3. Measuring instruments that have smaller-scale parts are more sensitive.
        4. Sensitive instruments need not necessarily be accurate.

        External Link

        Measurement and Error

        Error

        1. Error is the difference between the actual value of a quantity and the value obtained in measurement.
        2. There are 2 main types of error 
          1. Systematic Error 
          2. Random Error

          Systematic Error

          1. Systematic errors are errors which tend to shift all measurements in a systematic way so their mean value is displaced. Systematic errors can be compensated if the errors are known.
          2. Examples of systematic errors are 
            1. zero error, which cause by an incorrect position of the zero point
            2. an incorrect calibration of the measuring instrument. 
            3. consistently improper use of equipment. 
          3. Systematic error can be reduced by 
            1. Conducting the experiment with care. 
            2. Repeating the experiment by using different instruments.

          Zero error

          1. A zero error arises when the measuring instrument does not start from exactly zero.
          2. Zero errors are consistently present in every reading of a measurement.
          3. The zero error can be positive or negative.

          (NO ZERO ERROR: The pointer of the ammeter place on zero when no current flow through it.)

          (NEGATIVE ZERO ERROR: The pointer of the ammeter does not place on zero but a negative value when no current flow through it.)
          (POSITIVE ZERO ERROR: The pointer of the ammeter does not place on zero but a negative value when no current flow through it.)

          Random errors

          1. Random errors arise from unknown and unpredictable variations in condition.
          2. It fluctuates from one measurement to the next.
          3. Random errors are caused by factors that are beyond the control of the observers. 
          4. Random error can cause by
            1. personal errors such as human limitations of sight and touch. 
            2. lack of sensitivity of the instrument: the instrument fail to respond to the small change. 
            3. natural errors such as changes in temperature or wind, while the experiment is in progress. 
            4. the wrong technique of measurement. 
          5. One example of random error is the parallax error. Random error can be reduced by 
            1. taking repeat readings 
            2. find the average value of the reading.

          Parallax error

          A parallax error is an error in reading an instrument due to the eye of the observer and pointer are not in a line perpendicular to the plane of the scale.

          External Link

          SPM Form 4 Physics Chapter 1 – Introduction to Physics

          Introduction to Physics is the first chapter in SPM Physics. Under this chapter, we will discuss physical quantities measurement, measuring instruments and scientific investigation.

          1. Physical Quantities
            1. Base Quantities
            2. Derived Quantities
            3. Exercises – Conversion of the Unit of Speed, Density and Pressure (Download pdf)
            4. Scalar and Vector Quantities
          2. Scientific Notation and Significant Figure
          3. Prefixes
          4. Measurement and Error
            1. Consistency, Accuracy and Sensitivity
          5. Measuring Instruments
            1. Ruler, Thermometer and Stopwatch
            2. Vernier Caliper
            3. Micrometer Screw Gauge
            4. Ammeter and Voltmeter
          6. Scientific Investigation
           

          Objective Questions

          1. Introduction to Physics 1
          2. Introduction to Physics 2
          3. Introduction to Physics 3
          Click on the image to enlarge it